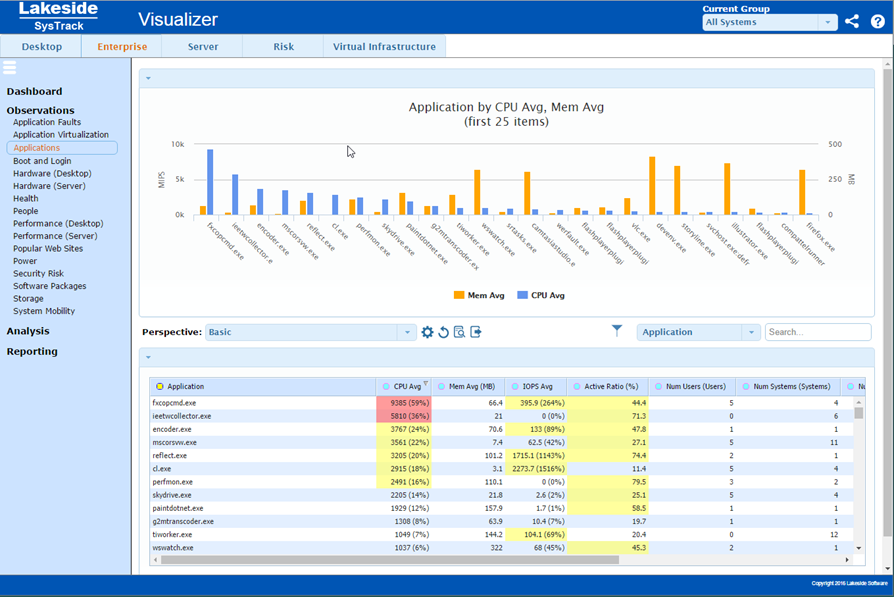
View the Applications Dataset
The Applications dataset is available from the Enterprise, Desktop, and Server modules. It provides insight into the behavior and use of applications, which are the executable components of Software Packages. In contrast to Software Packages, which often represent purchasable and installable bundles of applications, applications are the individual executable components that consume resources on computers.
Each application in the visualized community is statistically analyzed and presented in this dataset with key performance indicators that may be helpful in planning the IT environment. These statistics help the IT architect to understand the resources demanded by applications for optimal performance, how the behavior of these applications may impact the user experience, and usage profile information that helps depict user communities that are made more productive through the use of these applications. Each perspective offered is designed to showcase this behavior as it may influence the delivery of IT resources in ways that make people more productive.

Applications Dataset Perspectives
Each dataset is provided with one or more Perspectives. See View Datasets for more information on dataset perspectives and how to customize your perspective display.
Basic
This perspective delivers a high level view of the applications used in the visualized community. For each application, key metrics that indicate the typical, overall resource consumption of the application along with usage data that helps qualify how it is used are shown.
CPU Technical Analysis
This perspective provides deeper technical data regarding CPU consumption by each application. Statistical data offered here promotes a finer level of understanding of the processor resource utilization for each application.
Memory Technical Analysis
This perspective provides deeper technical data regarding memory consumption by each application. Statistical data offered here promotes a finer level of understanding of the memory resource requirements for each application.
I/O Technical Analysis
This perspective provides deeper technical data regarding disk I/O consumption by each application. Statistical data offered here promotes a finer level of understanding of the I/O behavior of each application.
Usage Summary
This perspective further qualifies how applications are used in the visualized environment. More detailed data regarding usage patterns may be helpful in planning support for these applications.
Application Startup Experience
This perspective offers insight into the startup delay experienced by users of the application. While some applications inherently require more time to start due to processing requirements during the load sequence, statistical measurements offered here may help to depict typical delays expected in this environment for each application.
Package Workload Details
Data delivered in this perspective helps to size the overall workload presented by a package in the visualized environment as operated by the community as a whole. Detailed technical data shown here may be helpful in understanding how a particular application presents a workload for the computing environment on which it runs.
Configuration Details
This perspective provides an analysis of the GPU and video support requirements, the Microsoft .NET framework requirements, and the Microsoft run time libraries that are required by each application.
Heavily Used Applications
Applications presented in this perspective are presented in order of usage intensity to provide a high level overview of what drives the most activity in the community.
Applications in Need of Standardization
Applications are easiest to support when only one version exists in the enterprise. In this graph, applications found in the upper right quadrant are those that are in use by many users and where many versions exist. Standardizing on one version of these applications will have the greatest impact to productivity and stability in the environment, while reducing support costs.
On This Page